I like to think of triathlon as a pure, individual sport. It’s just you against the clock. And physics. Competitors don’t really come into play. Sure, they may provide a bit of a mental or emotional kick to fire up your competitive side, or they may offer words of encouragement when it feels like you can’t take one more stroke, turn the crank one more time or take another step, but really, it’s just you and the clock. Your competitors shouldn’t influence your performance.
But, as triathletes, we like to gain that little edge of performance whenever we can. Money gets spent on new bikes, aero helmets or the latest widgets that will give an edge. Looking for tenths of a percent of a gain is a big deal. But, are whole percentages (!!) being left on the table by optimizing bike performance?
The concept of drafting is not new — birds have been using the same principles for millions of years to improve flight efficiency. Prius drivers have been doing it for 10+ years to improve fuel economy behind transport trucks. Cyclists have been doing it ever since the first stage races. We know that it can impact our performance, but by how much?
In an effort to answer this question, we turned to computers. Using computational fluid dynamics, (CFD), it’s possible to simulate the impact of drafting at different distances. We worked with one of our favourite triathletes, Cody Beals, to get a 3D scan and test the drafting hypothesis. Testing several different draft distances we were able to get some interesting results.

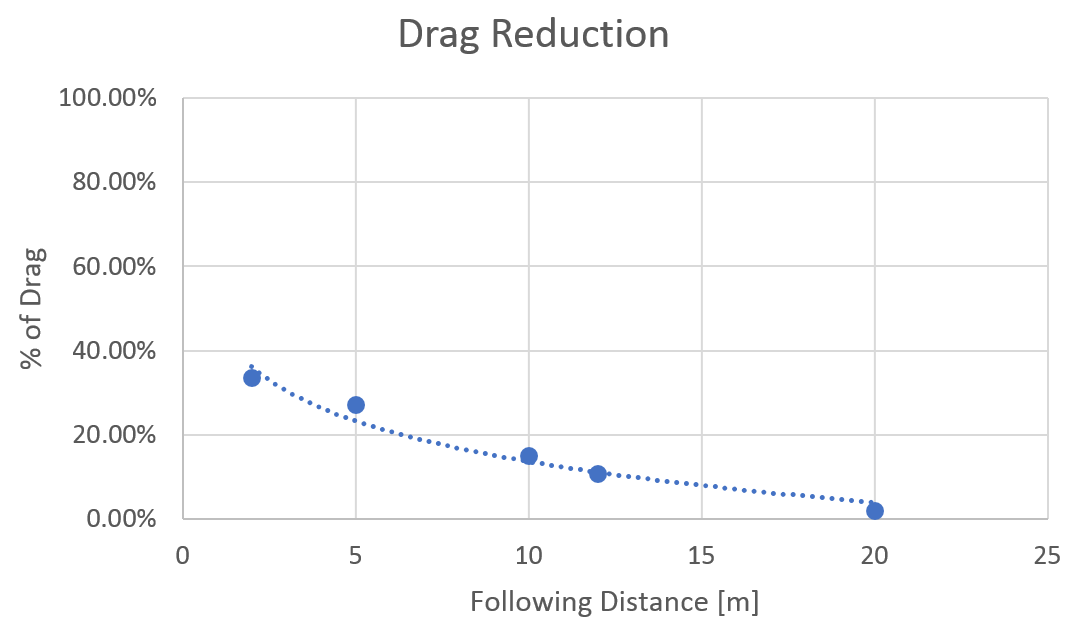
Looking at our first plot, we can see that even at a following distance of 15m, there is still a 9% reduction in drag. Extending out to 20m, it tapers off to 3%, which is negligible for the purposes of gaining a noticeable performance advantage. The 12m draft zone allowed in Ironman events still appears to be within the sweet spot of “getting free speed”, which is why some pros have recently been outspoken about the impact this has on formation of a “peloton” in a sport that should remain an individual effort.
Now as a comparison, if Cody Beals were following STAC’s resident programmer (and self proclaimed “barn door”), Art Hare, would this make a similar impact? For reference, Cody’s drag at a given speed is about 35% lower than Art’s, which is a massive difference.
At a following distance of 10m, Cody’s drag would be reduced by a further 5% when trailing Art rather than someone of Cody’s own size. Similar results are true for the other distances as well. It appears that who you’re following matters in addition to how far you’re following.
So, now that it’s clear that the aero benefit extends well beyond the allowed 5m (AG short course), 10m (AG long course), 12m (Ironman – Pro) even up to the new 20m draft length in the Challenge series races, it begs the question of how much time and effort it would take to pass.
Turning to our friend (or sometimes, enemy) mathematics, and using Cody’s slippery aero numbers, we can actually simulate the effort required for him to complete the pass under draft conditions. As a baseline, we’ll assume that he’s following a pro of similar size and aerodynamics.

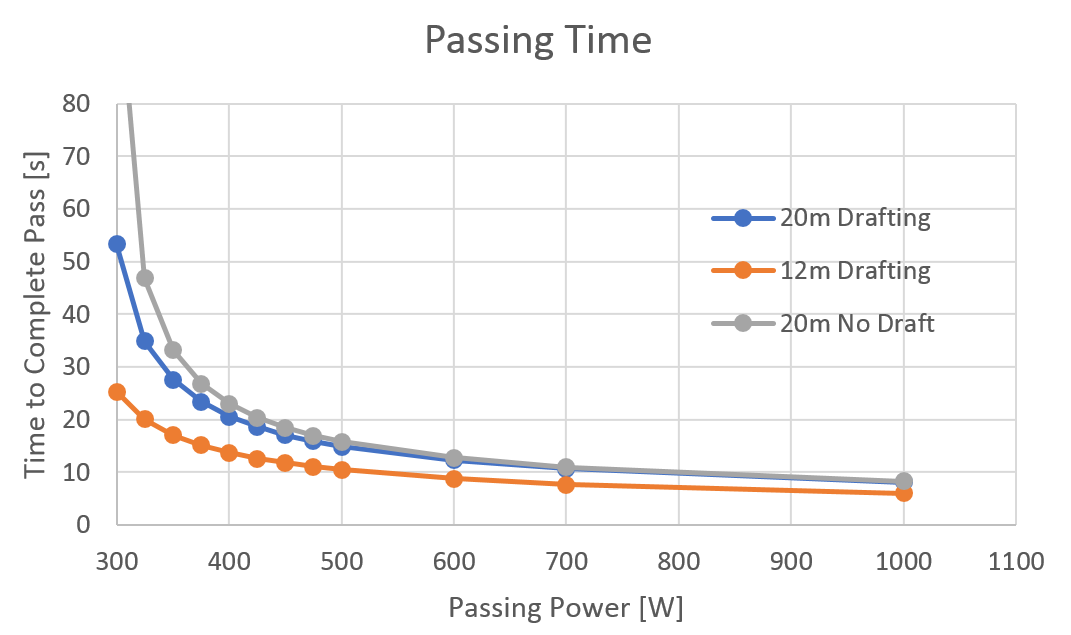
The sweet spot for passing really seems to be in the 350 to 400W range. Lower wattage mean that the pass is really dragged out, and takes nearly a minute at a 20m distance, which would incur a drafting penalty. Higher wattages offer diminishing returns, whereby a significant increase in effort does not return a massive time savings. Besides, there’s no bonus for getting through the passing zone faster. What’s really interesting is that when not using a draft, the time required to pass at moderate wattages can be 50 to 100% longer when not drafting! That’s right, this means that in a crosswind situation where you don’t catch the draft, it is a lot tougher to pull off the manoeuvre.
From this analysis, we’ve shown two very clear trends: a moderate additional effort is required to legally pass at the pro level, and the benefits of drafting extend a long way back from the leading rider. Whether or not you choose to use this information or “dodge the draft” at your next race is up to you!


